Graph Plot
Advertisement
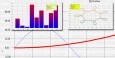
MathGV v.4.1.0.501
MathGV is a mathematical function graphing software program for Windows XP, 2003 and Vista. It can plot 2 dimensional, parametric, polar, and 3 dimension functions. MathGV contains no spyware, adware or similar problematic features.
Advertisement
UCalc Graphing Calculator v.4 6
If you are a student who wants to plot those equations the teacher gave for math assignment, or an engineer looking for a great scientific calculator, or a home user who wants to convert between units of measure (such as teaspoons to tablespoons for
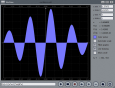
WinDraw v.1.0
This software utility can plot regular or parametric functions, in Cartesian or polar coordinate systems, and is capable to evaluate the roots, minimum and maximum points as well as the first derivative and the integral value of regular functions.
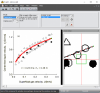
ScanIt v.2.0
Obtain data from images of graphs scanned from articles or available as image; define locations of the graph's axes, pick points, scan points or scan curves, copy the scanned data to Excel or save to file.
CurveExpert Professional for Mac OS X v.1.0.2
CurveExpert Professional is a cross-platform solution for curve fitting and data analysis.

CurveExpert Professional for Linux v.1.0.2
CurveExpert Professional is a cross-platform solution for curve fitting and data analysis.

Phaser v.3.0
Phaser provides a powerful, yet inviting, computing environment specifically crafted for the graphical and numerical simulations of differential and difference equations, from linear to chaotic.
AnalyticMath v.1.1.3
This program is a mathematics and graphing software with an editor,
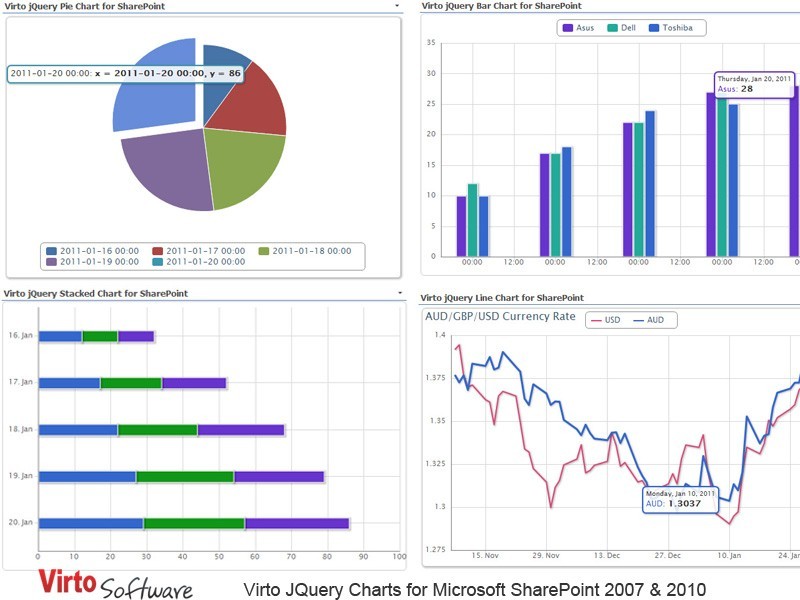
Virto JQuery Charts for SharePoint v.1.0.1
Virto Charts is a jQuery-based control for creating plots, graphs and charts in Microsoft SharePoint.
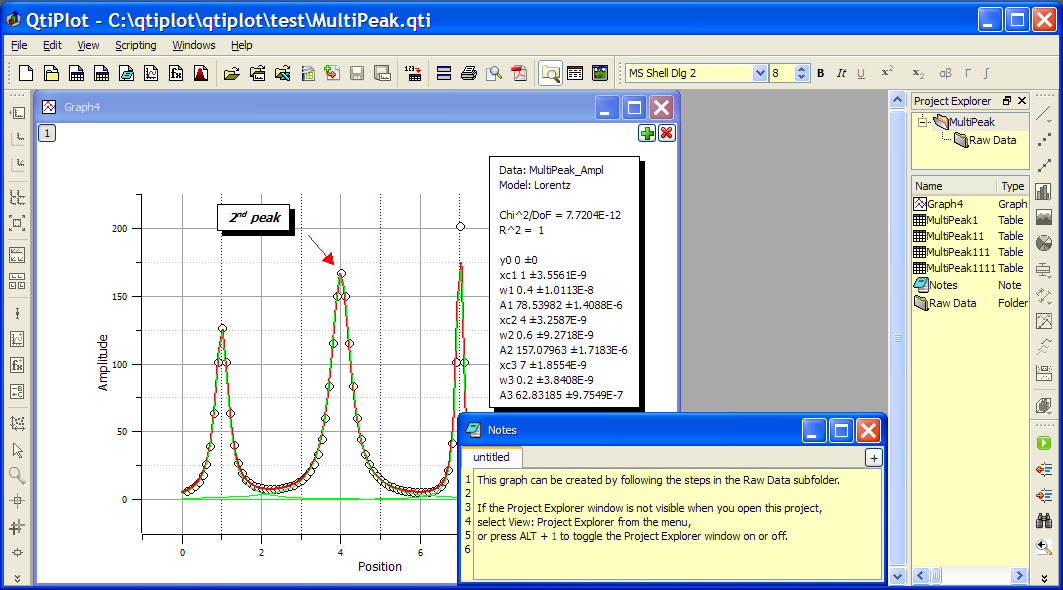
QtiPlot for Linux v.0.9.8.9
QtiPlot is a cross platform data analysis and scientific visualisation solution.